Business
AI stock selloff hits Wall Street; Dow drops over 1,400 points
Nasdaq Composite fell 4.7% at 12:26 p.m. ET as AI worries hit stocks. These are intraday figures, not closing results.
What to know
- U.S. stocks sold off on November 5, with AI-linked shares at the center of the pressure.
- The figures above describe the updated AP intraday report, with Dow and Nasdaq figures as of 12:26 p.m. ET. They should not be treated as the final daily losses.
- Reuters reported renewed concerns about returns on AI spending and said the Nasdaq was on course to confirm a correction.
- A Nasdaq decline, a Dow point loss and a market-wide trading halt are different measures. Understanding which benchmark is being cited helps put the headlines in context.
U.S. stocks fell sharply Thursday, November 5, as selling in artificial-intelligence shares spread through major market indexes. At 12:26 p.m. Eastern, the Dow Jones Industrial Average was down 1,433 points, or 2.7%, and the Nasdaq Composite was down 4.7%, according to the Associated Press. In the same updated report, AP put the S&P 500 decline at 3.5%.
These are timestamped intraday figures, not closing results or a live price feed. The distinction matters during a session in which prices can move substantially between a news report, a social-media post and the moment someone opens their investment account.
Why are AI stocks under pressure?
The immediate market story is a reassessment of the expectations behind the AI expansion. In a separate report, Reuters described investor fears that the midterm election results could slow infrastructure expansion. That is a report about expectations and political risk, not confirmation that all planned data centers have been stopped.
There are two financial questions beneath that concern. How quickly can additional computing capacity be brought into service? And how much cash will that capacity eventually earn compared with what it costs to build and operate? Investors can change their answers to those questions before a company changes its reported sales.
A useful way to separate the issues is to follow the money through a project. A developer needs facilities, equipment and electricity before customers can use the finished capacity. Equipment suppliers may receive orders earlier in that process, while a cloud provider earns revenue as customers consume computing services. Delays or changes in expected demand can therefore affect different companies at different times. This is an explanation of the business model, not a finding that every company in the sector faces the same problem.
NewsCubby's earlier coverage of Microsoft's cloud growth and infrastructure spending, Alphabet's earnings-related stock decline and Meta's credit outlook examines those separate pressures. Those reports provide background, rather than updated prices for Thursday's session.
Why can an AI selloff affect a broad stock index?
An index is a selected basket of securities, not a count in which every company necessarily has equal influence. The Securities and Exchange Commission's Investor.gov explanation of index funds describes how many indexes use market capitalization to determine a company's weight. Market capitalization is share price multiplied by shares outstanding.
Under that approach, a large company can have a greater effect on the benchmark than a smaller one experiencing the same percentage move. An index can consequently fall sharply even when some of its members rise. Looking only at the headline index change does not reveal how many businesses advanced, how many declined or which sectors held up best.
The Dow uses a different construction: it is price-weighted, according to the SEC. That helps explain why its point movement should not be compared directly with the point movement of another index. Percentages make the scale more comparable, while the composition and weighting explain why the benchmarks can still travel in different directions.
For example, a hypothetical 1,000-point decline represents 2% of a 50,000-point index but 5% of a 20,000-point index. Those figures illustrate the arithmetic only; they are not additional quotes from Thursday's trading. A point total becomes informative when readers also know the starting level and percentage change.
Are the Nasdaq Composite and Nasdaq-100 the same?
No. Headlines sometimes shorten both names to “Nasdaq,” which can make two accurate reports seem inconsistent. Nasdaq's index description identifies the Nasdaq-100 as an index of 100 of the largest domestic and international nonfinancial companies listed on its stock market. The Composite is a different benchmark.
This article's 4.7% figure refers specifically to the Nasdaq Composite in AP's 12:26 p.m. ET snapshot. Readers comparing that number with another report should check both the full index name and the observation time. A percentage quoted for the Nasdaq-100 should not be substituted for the Composite, even when their moves happen to be similar.
The same care applies to futures, regular-session prices and after-hours trading. They describe different instruments or trading windows. A headline about a futures decline before the opening bell cannot automatically serve as the closing result for the underlying stock index.
What does a correction mean?
In market reporting, a correction generally means a decline of at least 10% from a recent peak. Reuters' Thursday account described the Nasdaq as being on course to confirm one. The wording matters: an intraday move through a threshold and a closing confirmation are different observations.
A correction is a description of a price decline. By itself, it does not establish that a recession has begun, that a particular company is insolvent or that the next trading day will also be negative. Those are separate questions requiring economic data, company information or future market results.
It also uses a different comparison from the day's percentage change. A daily loss compares prices with the previous close; a correction compares them with an earlier peak. Readers should not add those percentages together or assume that the correction began entirely during one session.
Does a big Nasdaq drop halt the whole market?
Market-wide circuit breakers use the S&P 500, not the Nasdaq Composite or a Dow point total. Investor.gov's circuit-breaker guide describes thresholds of 7%, 13% and 20%, measured against the S&P 500's previous closing level.
Under the published rules, reaching the first or second threshold before 3:25 p.m. ET results in a 15-minute market-wide halt. Those levels do not trigger that halt at or after 3:25 p.m. A 20% decline triggers a halt for the remainder of the trading day. Individual securities also have separate volatility controls.
These rules explain what the thresholds mean; this article is not reporting that a market-wide circuit breaker was activated Thursday. A social-media post announcing a large decline in a different index does not establish that one occurred. An actual halt requires confirmation from the exchanges or other reliable reporting.
What does the selloff mean for retirement accounts?
The answer depends on the investments inside the account. A retirement account is a way to hold investments, not a single portfolio with a universal return. Someone holding a technology-focused fund may have different exposure from someone holding a combination of broad stock funds, bonds and cash.
The SEC's asset-allocation guide explains that the appropriate investment mix depends on a person's time horizon and tolerance for loss. Diversification spreads exposure across and within categories. It can reduce concentration risk, but it does not promise protection against every decline.
A practical first step in understanding an account's movement is to identify its holdings, the benchmarks its funds track and the date of the values being displayed. Several funds can hold overlapping companies, so owning multiple fund names does not necessarily mean owning unrelated risks. Fees, fund structure and the timing of valuation can also make an account's return differ from a headline index.
The SEC's guidance for volatile markets emphasizes reviewing financial goals and risk tolerance before making rapid decisions. This report explains the news and market mechanics; it does not recommend buying, selling or changing any reader's investments.
What remains unknown, and what comes next?
The closing index levels, the eventual breadth of the decline and any subsequent company responses remain separate developments from the intraday snapshot reported here. The open question for AI-linked businesses is whether changes in spending, construction schedules and customer demand will support or weaken the expectations embedded in their share prices.
For readers following the rest of the session, the most useful checks are straightforward: the timestamp on each quote, the exact index named, whether a policy concern has become an actual decision, and whether a company has issued new information. Keeping those distinctions visible prevents an early market reading from becoming an inaccurate account of the whole day.
Video image credits
The accompanying NewsCubby video uses archive photographs, not images of the November 5, 2026 trading session.
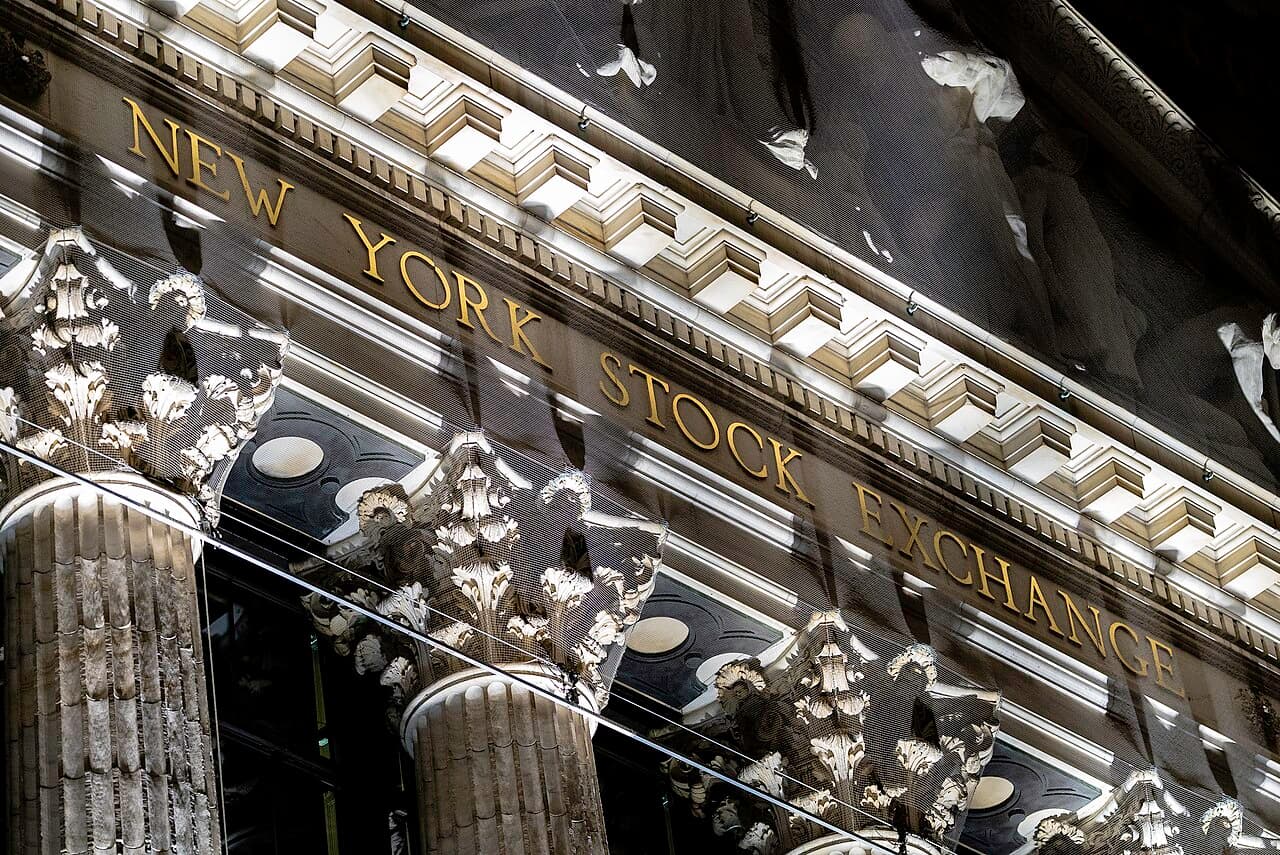
- New York Stock Exchange sign, January 5, 2021: Billie Grace Ward / Wikimedia Commons, CC0 1.0.
- Nasdaq Tower, May 12, 2026: Nielsoncaetanosalmeron / Wikimedia Commons, CC BY 4.0. Cropped to the building and signage, excluding bystanders. No endorsement implied.
- NERSC server racks, October 14, 2011: Chiara Coetzee / Flickr, also available on Wikimedia Commons, CC0 1.0. Historical computing infrastructure shown for illustration; not an affected company or a modern AI facility.
Video photographs were cropped and resized, with pan/zoom, gradients and text overlays added. The explanatory flow and closing timing graphic are original NewsCubby graphics, not market-price charts. The NewsCubby logo is the publisher's existing brand asset.
*Want more? Explore today's headlines on NewsCubby and join My Day free to make NewsCubby part of your day.*
*ARCHIVE PHOTO: New York Stock Exchange sign on Broad Street, January 5, 2021. Not the November 5, 2026 trading session. Photo: Billie Grace Ward / Wikimedia Commons / CC0 1.0.*
*Prepared with AI assistance.*
Reporting Sources
- Associated Press: U.S. stock selloff, November 5
- Reuters: Nasdaq on course to confirm correction
- Reuters: AI infrastructure expansion concerns
- SEC Investor.gov: Index funds
- Nasdaq: Nasdaq-100 index overview
- SEC Investor.gov: Stock market circuit breakers
- SEC: Asset allocation and diversification
- SEC: Investing decisions in volatile markets
- Video Photo: Chiara Coetzee / Flickr / CC0 1.0 (archive server racks)