Business
Global stock selloff reaches Asia as Seoul trading pauses
Japan and South Korea suffered sharp early losses after Wall Street’s November 5 rout. Asian figures are intraday, not closing results.

What to know
- Asian stocks fell sharply early November 6 after the previous session’s heavy U.S. losses.
- South Korea’s benchmark dropped enough to trigger a temporary trading halt; Japan’s Nikkei fell more than 6% shortly after opening.
- The Nasdaq Composite’s 5.5% loss and the S&P 500’s 4.4% decline are November 5 closing figures.
- Earnings disappointments, questions about AI investment and energy-related inflation form different parts of the backdrop. No single explanation accounts for every market.
**Market snapshot: early Asian trading on November 6, 2026; U.S. and European comparisons refer to November 5. This is a recorded report, not live pricing.**
The technology-led stock selloff moved into Asia on Friday, November 6, bringing a temporary trading interruption in South Korea and steep early losses in Japan after a punishing session on Wall Street. Reuters reported that Seoul trading was halted after an 8% decline, while Japan’s Nikkei fell more than 6% shortly after the open. Associated Press independently reported the sharp early Japanese decline.
The regional escalation is the new development. NewsCubby’s November 5 Wall Street report covers the preceding U.S. session. Friday’s Asian trading adds a different test: how markets with their own technology companies, investors and trading rules respond after absorbing those U.S. losses overnight.
What happened in South Korea and Japan?
Reuters’ early November 6 report described the Seoul halt and the Nikkei’s opening slide. A separate Bloomberg markets report put the KOSPI’s early decline at 8.8% and reported that Samsung Electronics and SK Hynix each fell more than 9%. Those are observations from a moving session, not final daily results.
A temporary halt interrupts trading under an exchange’s volatility rules. It does not erase losses, guarantee a recovery or establish where prices will finish. Nor should a report that a halt occurred be converted into a statement that the market remains closed. Readers following a developing session need a fresh exchange notice or reliable update before treating an earlier interruption as ongoing.
The numbers also describe different baskets of shares. Japan’s Nikkei and South Korea’s KOSPI cannot be combined into a single Asian percentage loss. Each has its own constituent companies and construction. A regional index provides another view, but that too needs its exact name, measurement time and comparison period before it can be meaningfully matched with a national benchmark.
For this report, the early-session description is more useful than a falsely precise running scoreboard. It preserves the verified scale of the opening shock without presenting a quote taken during trading as a closing result. Later prices may show a partial recovery, a deeper decline or a different pattern across markets.
How severe was the preceding U.S. session?
At the November 5 close, the Nasdaq Composite fell 5.5%, the S&P 500 lost 4.4% and the Dow Jones Industrial Average dropped 3.4%. The Philadelphia Semiconductor Index fell 12.2%. Reuters reported those results in its global markets account, which described disappointment over earnings and renewed questions about AI investment.
The difference between the chip benchmark and the broader indexes shows why the sector detail matters. A household invested in a semiconductor-focused fund does not have the same exposure as a household holding a broad stock-and-bond mix. Even two equity funds can behave differently because they own different companies or give the same companies different weights.
Percentage changes are the most straightforward starting point for comparisons. Point losses depend on the level and construction of an index. A large point figure can sound dramatic without conveying how much of the benchmark’s value changed. The relevant questions are the percentage move, which index it describes and whether it represents a completed session.
Why are investors questioning the AI buildout?
Reuters linked the pressure to earnings disappointments and investor concern that a Democratic Congress could slow infrastructure expansion. It also reported that Qualcomm’s smartphone-chip sales missed estimates. That company-specific result should not be treated as a direct measurement of demand for every AI product or every kind of semiconductor.
An earnings release and a comparison with analysts’ forecasts answer different questions. The release reports company results; the comparison shows how those results measured against expectations. A business can generate revenue and still disappoint investors who anticipated more. Its stock price can also reflect expectations about future years, not simply the quarter that has just ended.
Large computing projects have several financial stages. Equipment must be ordered, facilities built or adapted, power secured and capacity made available to customers. The eventual revenue depends on demand, pricing and usage. Investors therefore have to judge both the likely return and the time required to earn it. A longer wait can change a valuation even if the underlying technology remains useful.
Political concern adds another uncertainty, but a market reaction is not proof of a policy decision. Expectations about permitting, energy access or congressional scrutiny must be distinguished from legislation that has passed or a project cancellation a company has actually announced. This report does not establish that all planned data centers will stop.
The broader cash question predates this session. NewsCubby’s coverage of Meta’s credit outlook explains why the timing of investment returns matters separately from reported growth. That article is background, not a current quote or evidence that every company faces the same balance-sheet pressures.
Did Europe experience the same scale of decline?
No. In its separate European closing report, Reuters said the STOXX 600 finished November 5 down 0.38% at 654.87. Technology shares fell 3.2%, while the French and Spanish benchmark indexes ended higher. Defense shares also weakened, illustrating that the session contained company and sector developments beyond AI.
“Global selloff” describes pressure reaching several regions. It should not suggest that every exchange, country or industry moved by the same amount. The relatively modest European headline decline and the much larger chip losses are compatible because they measure different sets of companies.
There is a timing issue as well. The European result above precedes Friday’s Asian session. It cannot establish how Europe will respond when its next session unfolds. A chart or headline that places those numbers beside one another should keep the dates visible rather than imply they were observed simultaneously.
Where do oil and interest rates fit?
Energy adds a separate source of pressure. Reuters reported that Brent crude settled November 5 at $98.29 a barrel, up 3.88%, amid renewed uncertainty about the Iran war. Higher energy costs can affect business expenses and household budgets even while technology share prices are falling.
The Bank of England’s November 5 decision demonstrates the policy complication. Its monetary policy committee voted 8–1 to raise Bank Rate by a quarter percentage point to 4%. The bank cited energy-related inflation pressures and projected that UK inflation would reach around 5% by the middle of 2027, while stressing that policy was not on a predetermined path.
That is a UK decision, not an announcement about U.S. interest rates or a proven explanation for the Asian decline. Its relevance is the broader tension: weaker asset prices do not automatically remove inflation risks. Policymakers must assess the economic data and the persistence of price pressures alongside financial conditions.
What should readers watch next?
The immediate checks are the Asian closing results, any further exchange notices and the next European and U.S. sessions. Company updates matter too: revised investment plans, actual customer demand and financing commitments provide firmer evidence than broad claims that the AI boom is either finished or guaranteed to continue.
For readers looking at retirement or investment accounts, the useful comparison is with what the account actually holds. Fund names alone may hide overlapping exposure to the same large companies. Overseas investments can also involve currency movements, so a local-currency index change and a U.S. investor’s return need not match exactly.
No opening decline establishes the next day’s direction. The verified development is already significant: selling pressure has crossed into a new trading region, including an exchange interruption, after a steep U.S. technology retreat. The next task is to track confirmed results and decisions without turning early prices, analyst explanations or political expectations into settled outcomes.
*Explore today’s reporting on NewsCubby and join My Day free for your news, weather and more.*
*Prepared with AI assistance. This report explains market developments and does not recommend buying or selling investments.*
Photo and video credits
The article thumbnail and accompanying video use archival photographs, not images of the November 2026 trading sessions. Historical displays visible in the photographs do not show current prices. No photographer or depicted organization endorsement is implied.
- **Tokyo Stock Exchange (6640616109)**, photographed December 26, 2011. Dick Thomas Johnson / Wikimedia Commons, CC BY 2.0. Cropped, resized, darkened and overlaid with NewsCubby branding and text for the article thumbnail and video scene; motion and overlays in the video. Archive exchange-hall context.
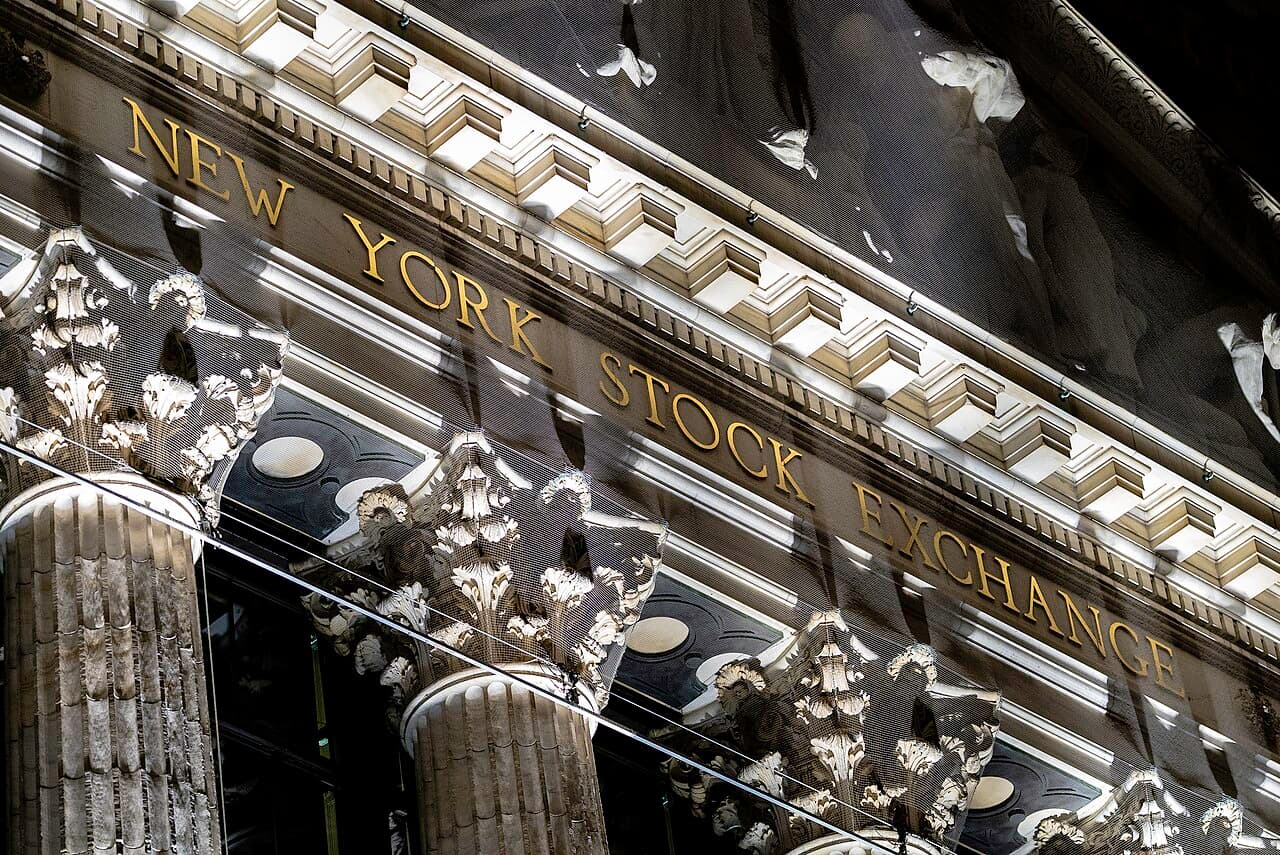
- **Sign of the New York Stock Exchange, Broad Street**, photographed January 5, 2021. Billie Grace Ward / Wikimedia Commons, CC0 1.0. Cropped and resized with motion and text overlays for the video.
- **Nasdaq Tower May 2026**, photographed May 12, 2026. Nielsoncaetanosalmeron / Wikimedia Commons, CC BY 4.0. Cropped to signage, excluding bystanders, resized, with motion and text overlays for the video. Archive facade, not the November selloff.
- **Front of server racks at NERSC**, photographed October 14, 2011. Chiara Coetzee / Flickr, also on Wikimedia Commons, CC0 1.0. Cropped and resized with motion and text overlays for the video. Historical computing infrastructure, not a current AI facility or an affected company.
The explanatory charts and timing panels are original NewsCubby graphics. The video uses synthetic narration and no background music.
- **Frankfurt am Main - Frankfurter Börse**, August 4, 2014. Fred Romero / Wikimedia Commons, CC BY 2.0. Cropped, resized, with motion, gradients and text overlays. Archival European exchange context.
- **Corner of the London Stock Exchange (28061584473)**, July 30, 2016. Paul Trafford / Wikimedia Commons, CC BY 2.0. Cropped to exclude bystanders, resized, with motion, gradients and text overlays. Archival exchange context.
- **New York Stock Exchange, interior lit edition (51693281831)**, September 5, 2021. Billie Grace Ward / Wikimedia Commons, CC0 1.0. Exterior facade with illuminated windows; cropped, resized, with motion, gradients and text overlays. Not the current trading session.
- **Electronic stock board in Yaesu, Tokyo 2007**, March 30, 2007. nappa / Wikimedia Commons, CC BY 2.0. Cropped, resized, with motion, gradients and text overlays. Visible prices are historical 2007 figures, not current market data.
- **Korea exchange**, March 2012. hyolee2 / Wikimedia Commons, CC BY-SA 3.0. The former Korea Exchange building in Busan appears as an unmodified full-photo inset, with caption and information outside the photograph. The original photograph retains its CC BY-SA 3.0 license. Not a photograph of the current trading halt.