Science
Lake Powell rises more than 20 feet, but recovery has a long way to go
Federal readings show an autumn rebound, but Powell remains far below full. Winter snow and spring runoff will help determine what comes next.
What to know
- Federal operational data for November 7 put Lake Powell at 3,538.56 feet above sea level.
- The same report lists about 6.359 million acre-feet of water, roughly 27.3% of its stated live-storage capacity.
- A higher surface level and a recovery of the Southwest's water supply are different measures. One describes the reservoir on a particular day; the other requires sustained improvement.
- Visitors should check the status of their specific launch ramp and current conditions rather than assume a rising lake has reopened every access point.
Lake Powell rose more than 20 feet between September 30 and November 7, according to dated readings from the Bureau of Reclamation. That is an accumulated autumn gain, not an overnight jump. The federal records give readers a clear starting point for measuring the improvement. Reclamation operational data
The change offers a meaningful improvement in a reservoir that had entered autumn severely depleted. It also poses a question that a dramatic shoreline photograph cannot answer: how much of the improvement will remain after the next season of inflows and water releases?
How much has Lake Powell risen?
The Bureau of Reclamation's November operational report shows a steady increase over the first week of the month. The reported elevation was 3,532.42 feet on November 1 and 3,538.56 feet on November 7. That is a gain of 6.14 feet across those dated observations.
A separate Reclamation status update, published October 15, gives the end-of-September level as 3,518.08 feet and storage as 5.16 million acre-feet. Comparing that elevation with November 7 produces a 20.48-foot increase since September 30 alone. It measures the change between two specific observations rather than claiming to identify the lowest point of the entire season.
Those starting dates matter. A headline about a 20-foot rise should not be read as a one-day measurement, and a month-end comparison should not be labeled a record-low comparison. The dates belong beside the number wherever it appears, including charts, video captions and social headlines.
Why does a higher lake still leave a water problem?
Powell is a storage reservoir behind Glen Canyon Dam, not an isolated body of water. Reclamation describes it as a reserve that helps the Colorado River system manage dry periods. The dam began impounding water in 1963, and the reservoir first reached its full elevation in 1980. Its role spans water storage and electricity production. Reclamation's Glen Canyon history
That history helps explain the difference between a welcome deposit and a rebuilt reserve. A household savings account can improve markedly after a deposit and still be much smaller than the cushion it needs. The analogy has limits, but it captures why both the direction of change and the amount remaining deserve attention.
The region also entered the new water year with substantial deficits. In its October 15 assessment, the federal drought information service said late-season moisture had brought localized relief without eliminating longer-term shortages. It cautioned that even a strong winter would not fully restore critically depleted major reservoirs. Drought.gov's regional assessment
Why don't feet and percentages tell the same story?
Surface elevation measures the height of the water. Storage measures its volume. A foot of additional water does not represent a constant volume across an irregular canyon reservoir: the area covered changes with elevation. USGS publishes detailed elevation-area-capacity tables derived from surveys to relate those measurements.
Storage capacity changes over longer periods, too. A USGS assessment released in 2022 found that sediment had reduced Powell's total potential storage by 6.79% between 1963 and 2018. Sediment carried into the reservoir settles and occupies space that previously held water. That study measured the shape and capacity of the reservoir; it was not a measurement of how full it was in November 2026. USGS storage study
Readers comparing dashboards should therefore check the observation date, units and capacity definition. Total capacity and usable live storage are not interchangeable denominators. A percentage without that context can look inconsistent with another published number even when each calculation uses its own stated basis correctly.
How does rain become water in the reservoir?
Runoff connects precipitation across a watershed with rivers and reservoirs downstream. Some water enters the ground; some moves over the surface. The proportion and timing depend on factors including rainfall intensity, where it falls and the condition of the soil before the storm. USGS lists those variables in its explanation of surface runoff.
This is why rainfall measured in one town cannot simply be multiplied into a prediction for Powell. A reservoir integrates what reaches it from a much larger drainage system. A rain gauge, a stream gauge and a reservoir reading describe related processes, but they do not measure the same thing.
Water also leaves exposed surfaces through evaporation, becoming vapor in the atmosphere. USGS explains that heat provides energy for that process. Evaporation and the water cycle The practical accounting question is what remains after incoming water, releases and other exchanges are considered. A larger inflow does not automatically mean an equally large addition to stored water.
Why will winter snow matter?
Mountain snow acts as another form of storage. Instead of running off immediately, water can remain in the snowpack and be released as it melts. Drought.gov distinguishes a dry snow drought, caused by insufficient cold-season precipitation, from a warm snow drought, when precipitation falls as rain or snow melts unusually early. Snow drought explained
For that reason, a wet forecast alone is not a guarantee of a strong spring water supply. The useful questions include where precipitation falls, whether it accumulates as snow and when it reaches rivers. NewsCubby's guide to NOAA's winter outlook explains the distinction between seasonal odds and an individual storm forecast. Its winter home-preparation guide covers the household implications.
What does the rise mean for dams and access?
Low-water planning has already prompted practical changes. Reclamation's drought-response program coordinates actions intended to reduce the risk of Powell falling below critical elevations; its public account says additional drought-response releases from upstream Flaming Gorge began April 23, 2026. That is evidence of active system management, not proof that November's gains remove the need for it. Drought-response operations
Earlier infrastructure work addressed local supplies. In January 2023, Reclamation announced a lower intake connection serving Page and the LeChee Chapter of the Navajo Nation. The project was designed to preserve access to water at very low reservoir elevations. Those contingency investments illustrate why the consequences of a low lake extend beyond scenery. Reclamation intake project
For boaters, access remains location-specific. The National Park Service's changing-lake-levels page lists ramps separately, with different minimum elevations and operating statuses. Its early-November information showed the Wahweap main ramp closed to motorized launching while the Stateline Auxiliary ramp was available for motorized vessels. Check that live page before traveling; an article is not a substitute for current operating information.
The park also warns that changing levels can shift channels and expose or conceal obstacles. Navigation crews cannot mark every hazard. Its boating advisory urges careful lookout, appropriate speeds and attention to updated markers. A higher lake should not be treated as an all-clear for unfamiliar routes.
What do we know, and what comes next?
The dated federal readings establish a substantial rebound. They do not establish the final size of the autumn gain, the amount of next spring's runoff or the reservoir's condition next summer. Those outcomes remain open.
Reclamation's subsequent observations and operating updates will show whether the improvement continues. Snow measurements will help describe the water accumulating upstream. For visitors, the park's ramp notices remain the more immediate source of decisions. The important test is whether this autumn's rise becomes part of a sustained recovery rather than a short-lived improvement in a still-depleted system.
Photo and video credits
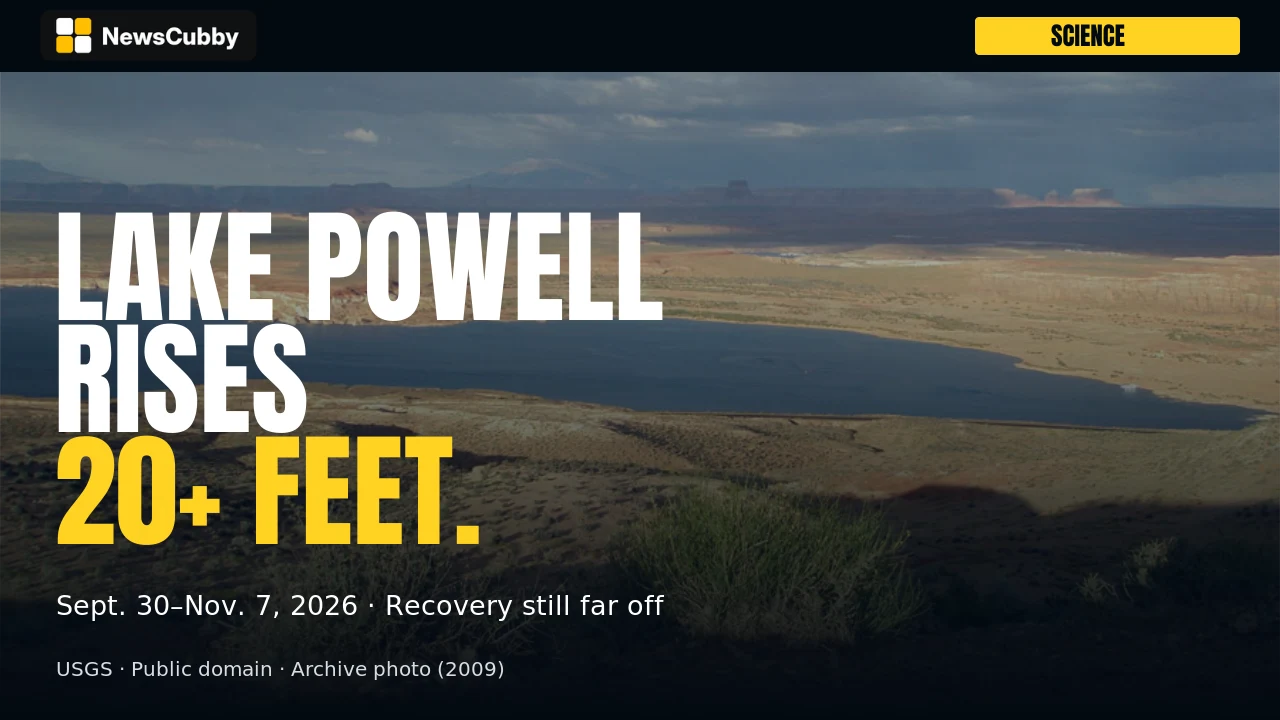
All photographs are archival and do not show November 2026 conditions. The cover and article image show Lake Powell from Wahweap Overlook; the other photographs appear in the matching video.
- Lake Powell from Wahweap Overlook near Page, Arizona, page dated November 19, 2009. Credit: USGS / Geology and Ecology of National Parks. Source and public-domain statement.
- Wahweap Marina, page dated November 19, 2009. Credit: USGS / Geology and Ecology of National Parks. Source and public-domain statement.
- Lake Powell south shore, page dated November 19, 2009. Credit: USGS / Geology and Ecology of National Parks. Source and public-domain statement.
- Lake Powell, approximately November 2017. Credit: USGS. Source and public-domain statement.
- Glen Canyon Dam, page dated February 27, 2024. Credit: Jordan Bush, ORISE participant, National CASC / USGS. Source and public-domain statement.
NewsCubby adaptations: cropped and resized for the cover, article card and video; text overlays and video pan/zoom added. No USGS endorsement implied.
*Want more? Explore today's headlines on NewsCubby and join My Day free to make NewsCubby part of your day.*
*ARCHIVE PHOTO: Lake Powell from Wahweap Overlook near Page, Arizona. USGS page dated November 19, 2009; capture date not separately stated. Photo: USGS / Geology and Ecology of National Parks / public domain. Cropped, resized and overlaid with text.*
*NewsCubby articles are produced with AI assistance.*
Reporting Sources
- Reclamation operational data
- Reclamation status update
- Reclamation's Glen Canyon history
- Drought.gov's regional assessment
- elevation-area-capacity tables
- USGS storage study
- explanation of surface runoff
- Evaporation and the water cycle
- Snow drought explained
- Drought-response operations
- Reclamation intake project
- changing-lake-levels page
- Its boating advisory
- Source and public-domain statement
- Source and public-domain statement
- Source and public-domain statement
- Source and public-domain statement
- Source and public-domain statement
Photo & Video Credits
Credit: USGS / Geology and Ecology of National Parks. License: Public domain. Source: file page.